


AirDnA is a tool for finding profitable Airbnb locations. After many hosts find success with their first rental they naturally think about investing in new properties, either buying or renting. You could try to figure this out on your own or with expert advice, but you can also use Airbnb tools like AirDna to give you more stats.
The most common question I get from these people is: How do I know where the best opportunities are? In which areas is renting on Airbnb most profitable?
How to find the best area for Airbnb
There are two factors to look at here: the carrying cost of the house (monthly mortgage payments or the monthly rent) and the profit. The first can be easily estimated. Before you sign the contract, you’ll know how much the rent or mortgage payments will be. The profit however is a very different story.

The potential profit you can make from your Airbnb in a certain area depends on the following factors:
- The demand for Airbnbs, i.e. how many people are looking to stay at Airbnbs
- The supply, i.e. how many Airbnbs are available
- Prices of other listings and alternatives such as hotels
- How well you do as a host
The last factor is the only one in your control and the best way to learn how to do well is to read this blog of course 🙂 , and sign up for the newsletter to stay updated.
The first three factors are tough to estimate. There are two ways you can about it: do the research yourself or use a data service like AirDnA.
Option 1: Do the work yourself
Here’s what you can do.
Estimate supply: do a search on Airbnb to see how many other listings there are and do the same for hotels on Booking.com or another hotel search engine. Don’t select any dates and select two nights to make sure all listings will show up (many listings have a two-night minimum stay).
Estimate demand: look at the calendars of a number of listings that are similar to the type of property that you are planning to buy or rent. Make sure to look at the listings that show up on the first page of the search results, as that’s where you will be if you do a good job. Look the average occupancy rates for these listings.
Estimate pricing: Look at the average price of the listings you’ve selected (this is shown in the price range selector), but also scroll through the calendar to see how prices vary with the seasons. Finally, have a look at hotel prices.
Now you have some information to work with to estimate the potential profits that you can make with your Airbnb.
[fancy_link title=”Download the list of my 6 favorite MIRACLE Airbnb tools” link=”https://getpaidforyourpad.com/tools/” target=”” style=”1″ class=”” download=””]
Option 2: Use the AirDna Rentalizer to calculate your profit
AirDnA provides data on the performance of Airbnb listing in over 2,500 cities to help Airbnb entrepreneurs target the most lucrative areas for new listings. It allows you to view the seasonality and occupancy rates for any town in the U.S. and over 25 international cities. You can also compare prices, and see how much current Airbnb listings are earning in each city.
This data isn’t only useful for targeting new areas, but can be extremely helpful in understanding the market in your current area. How much does demand for rentals in your city go up for weekends and holidays? Are there any special events that drive up demand throughout the year that you are unaware of? AirDnA shows you the exact demand for every day over the past year to make sure you don’t miss out on these opportunities.
Here’s an example of pricing information the city of Santa Monica, CA:

This information is available on the website for free, click here to check out prices in your area. If you want to have more details, such as occupancy rates and daily demand, you can purchase subscription plans starting at $9.99 a month.
[fancy_link title=”Download the list of my 6 favorite MIRACLE Airbnb tools” link=”https://getpaidforyourpad.com/tools/” target=”” style=”1″ class=”” download=””]
AirDna Review
Let’s get into the details of what AirDnA has to offer. The tool is definitely one of the most powerful tools I’ve seen in the short term rental space and it offers incredible value. It consist of three separate tools: Market Minder, Investment Explorer and Rentalizer.
Market Minder
Market Minder is AirDnA’s newest tool. It’s a state of the art tool that helps you dive deep into the world’s major short-term rental markets and understand historical trends and opportunities. This allows you to understand the competition and figure out how to optimize the performance of your vacation rental.
More specifically, Market Minder allows you to
- Search for new locations that feature the best performing vacation rentals and properties
- Compare different market performance trends
- Purchase the most optimal vacation rental property, in the best performing markets, at the best time
- Spy on your competition in order to uncover their strengths and weaknesses
- Create custom price strategies based on historical and future market demand data
In order to show you the power of the tool, I’ve selected my neighborhood The Pijp in Amsterdam. Let’s start with the information that’s available for free.

In the image above you can see all the listings in my neighborhood. The map is interactive, you can filter for number of bedrooms and when you hoover over one of the listings you can see the average daily rate. Pretty neat information considering it’s available for free. You can use this info to decide what price to charge for your listing. If I were to pay $59.99 I’d be able to also see occupancy rate and annual revenue.

The other information that’s provided is the number and distribution of active hosts, active rentals, rental size and rental activity. When you hoover over the graphs you’ll see a popup with information about what’s being shows. For example, for rental activity the different colors represent how long the rentals are available and booked and the categories are 1-3 months, 4-6 months, 7-9 months and 10-12 months.
The Airbnb Investment Explorer
The investment explorer is solely meant as a tool to help discover vacation rental investment opportunities in the US. It provides benchmark rental performance data from over 4,000 cities and allows you to see exactly how much full time Airbnbs are making in different areas.
One of its most powerful features is that you can select a type of unit (for example a 1 bedroom apartment) and have the tool plot the average cost to rent versus average Airbnb revenue for all of the US. This way to can see exactly where the rental-Airbnb arbitrage is most profitable.

As with all graphs that AirDnA provides, it’s interactive so when you hoover over a location you’ll be able to see actual numbers. It’s pretty cool.
The investment explorer is a powerful tool, but it comes at a hefty price point: $199 a month for state level access, $499 a month for nation wide access. This makes the tool solely interesting for people who are planning to purchase a property to rent out on Airbnb.
The Rentalizer
The Rentalizer (which is completely free to use!) is solely meant to access the profitability of a well run Airbnb rental in a certain location. You simply enter the address and the type of property and Rentalizer will provide you with a detailed report on the expected revenue that you could make. It only works in the US market.

To show you what that report looks like, I’ve entered the address of the old building I used to live in in Chicago.
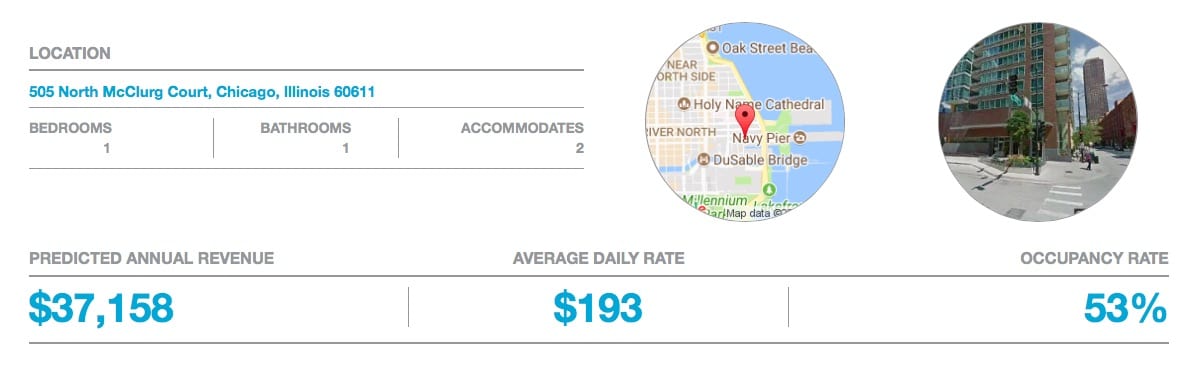
The report even shows a picture of the building (which made me feel a little bit nostalgic, those were fun times in Chitown…), the predicted revenue, average daily rate and occupancy rate. If you’re a frequent reader of this blog you’d do much better of course :).

Next you can see the breakdown in revenue per month. As the winters in Chicago are unbearable for human beings, it makes sense that the predicted revenue is much lower during the winter than during the other seasons.

Perhaps the coolest feature of Rentalizer is that you can see revenue and occupancy rates of similar, existing Airbnb properties in the area.
This tool is available completely free to the public for a limited time.
More info:
- Listen to the podcast interview I did with the founder Scott Shatford.
[fancy_link title=”Download the list of my 6 favorite MIRACLE Airbnb tools” link=”https://getpaidforyourpad.com/tools/” target=”” style=”1″ class=”” download=””]